How to Check WordPress Plugin CPU Usage and Fix High Server Load
If your WordPress site has been loading slowly, or your hosting provider has flagged your account for high resource use, the problem is almost certainly CPU overload. Most site owners notice the symptom first: pages timing out, admin panels dragging, or a warning email from the host. What they rarely get is a clear explanation of where the load is coming from.
Plugins are the most common source of WordPress high CPU usage. Each one adds code that runs on every page request, and when several are active at once, the processing cost adds up fast. Background tasks fire at the wrong time, security scanners run on every visit, and bloated page builders generate work the server has to repeat continuously.
This guide walks you through how to check WordPress plugin CPU usage, how to isolate the specific plugin causing the spike, and what to do once you find it.
What Does CPU Usage Mean in WordPress?
Every time someone visits your WordPress site, the server runs PHP scripts, queries the database, and assembles a response. This processing requires CPU (central processing unit) resources. On shared hosting plans, those resources are capped, and if your site repeatedly approaches or exceeds that cap, the host will throttle your service or warn you.
WordPress itself is not unusually heavy, but plugins add code that runs on every request. A single poorly optimized plugin can trigger multiple database queries, make external API calls, or run background tasks, all of which add to the server’s workload. Understanding WordPress plugin CPU usage starts here: it is rarely one request that causes the problem, but the cumulative cost of many plugins running simultaneously. If your website is causing high CPU usage, the combined load from several active plugins is usually where to look first.
How to Measure WordPress Plugin CPU Usage
Measuring WordPress plugin CPU usage accurately requires looking in two places: your hosting dashboard for the overall picture, and a profiling tool inside WordPress for plugin-level detail.
Method 1: Check Hosting Resource Usage (Quick Overview)
The fastest starting point is your hosting control panel. Most shared and managed hosts, including SiteGround, Bluehost, and similar providers, display CPU usage graphs in the account dashboard. Look for a section labeled “Resource Usage” or “Statistics.” These graphs show usage over time, which helps you identify when spikes occur and whether they are consistent or tied to specific events.
If your host provides access to raw server logs, those can be even more useful. Cross-referencing a CPU spike in the graph with request timestamps in the logs can reveal which scripts or URLs are responsible for the surge.
Method 2: Use Performance Monitoring Plugins
Query Monitor plugin is one of the most practical skills you can develop for diagnosing WordPress CPU usage. Query Monitor is a free WordPress plugin that profiles every page load in real time. It shows you how many database queries were run, which plugin triggered them, how long each query took, whether any external HTTP calls were made, and whether any PHP errors were fired. All of this appears directly in your WordPress admin bar and a panel at the bottom of the screen, with no server access required.
One important note before you start: Query Monitor captures a snapshot of the current page load only. It does not log historical data or background events. If your CPU spikes happen during scheduled tasks or off-peak hours, Query Monitor will not catch those. For the purposes of identifying which active plugin is driving WordPress plugin CPU usage on regular page requests, it is the right tool.
Before you begin: turn off caching
Disable any caching plugins (WP Rocket, W3 Total Cache, LiteSpeed Cache) and any host-level caching before running Query Monitor. If caching is active, you will be measuring the speed of a cached response, not the actual server work, and the data will not reflect the true cost of your plugins. Re-enable caching once you have finished diagnosing.
Step 1: Install Query Monitor
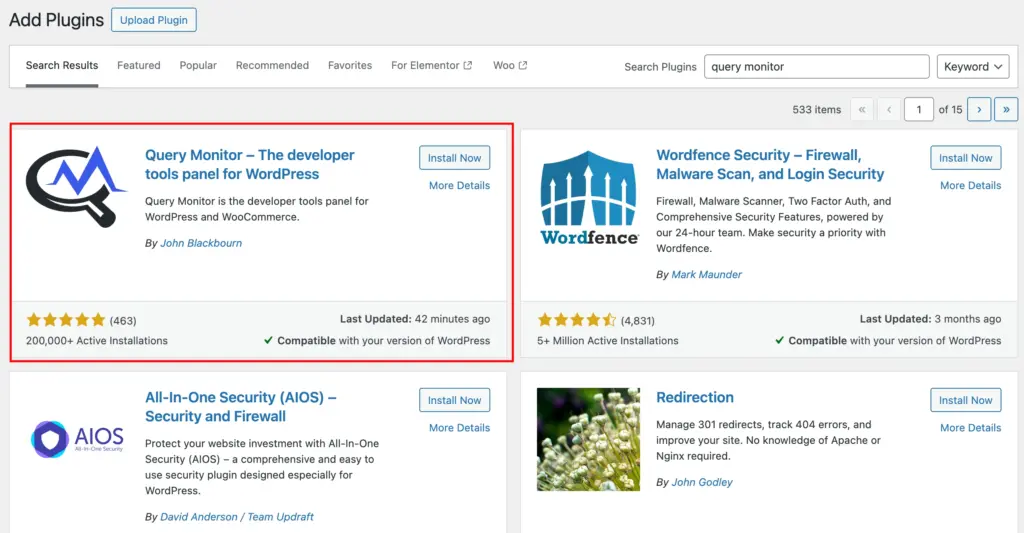
The very first step is to install the new plugin. Go to Plugins > Add New, search for “Query Monitor“, install, and activate. No configuration needed.
Step 2: Disable caching first
Turn off any caching plugins and host-level caching before running tests. If caching is active, you will measure cached responses, not actual server work. Re-enable it once you are done.
Step 3: Load the page and read the admin bar

While logged in as an admin, visit the page you want to diagnose. Query Monitor adds four metrics to your admin toolbar: page generation time, peak memory usage, database query time, and total query count. Orange or red highlights mean something needs attention. Click the metrics bar to open the full panel.
Step 4: Find heavy plugins using Queries by Component
Go to Queries > Queries by Component. This is the core WordPress plugin analyzer view inside Query Monitor. It groups every database query by the plugin, theme, or WordPress core that triggered it, sorted by total query time. Any plugin running significantly more queries than others, or consuming the most query time, is a likely contributor to your WordPress plugin CPU usage. Deactivate it temporarily and reload the page to confirm whether metrics improve.
Step 5: Check for slow and duplicate queries
The Slow Queries tab flags any query taking over 0.05 seconds. The Duplicate Queries tab shows queries that ran multiple times in a single page load. Both indicate inefficient plugin code. Use the call stack (the blue “+” icon) to see exactly which plugin file triggered the problem.
Step 6: Review HTTP API Calls
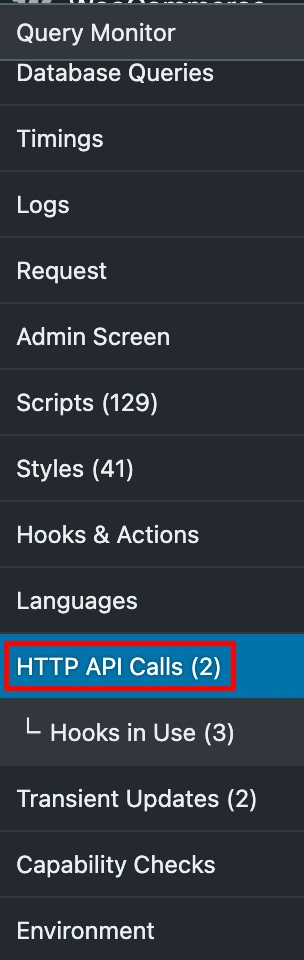
Open the HTTP API Calls panel to see any external requests made during the page load. A plugin making slow or failing external calls holds the PHP process open until the request times out, which adds directly to your load time. This panel is particularly useful when your WordPress site is using too much memory or load time is high but query counts appear normal.
Deactivate Query Monitor when done. It adds its own overhead and is a diagnostic tool, not a permanent one.
How to Isolate the Plugin Causing High CPU Usage
Once you have confirmed that CPU usage is high, the next step is identifying which plugin is responsible. The most reliable approach is a binary elimination method: deactivate all plugins, check whether CPU usage drops, then reactivate them in small groups until usage climbs again.
To do this safely, start by deactivating all plugins from the WordPress dashboard under Plugins > Installed Plugins. If your site becomes inaccessible when a plugin is deactivated, use FTP or your hosting file manager to rename the plugin’s folder in wp-content/plugins, which disables it without needing dashboard access. Reactivate plugins one by one or in groups of two or three, allowing enough time between activations to observe any change in resource usage. When CPU spikes return, you have found the likely culprit.
Common Reasons Plugins Cause High CPU Usage
Not all plugins are heavy by design. Several common behaviors drive WordPress plugin CPU usage higher than necessary.
Plugins that run scheduled background tasks, such as backups, security scans, or content indexing, can overlap with real visitor traffic if timed poorly. WordPress uses a pseudo-cron system called WP-Cron, which fires on page loads rather than at fixed server intervals. On high-traffic sites, this means background tasks can stack up across multiple simultaneous requests.
Page builder plugins and visual editors tend to load large amounts of JavaScript and make multiple database calls per page render. On cheaper shared hosting, this alone can push WordPress plugin CPU usage to its limit.
Security and analytics plugins that log every visitor action, run real-time scans, or poll external APIs on each request are also frequent contributors. The issue is not that these functions are unnecessary, but that they often run more frequently than needed.
Finally, plugins that are no longer maintained may lack the performance improvements introduced in newer versions of PHP and WordPress, causing them to run less efficiently than their modern equivalents. A WP query console plugin or profiler can help surface these inefficiencies in older, unmaintained code.
How to Reduce WordPress Plugin CPU Usage
Once you know what is driving WordPress plugin CPU usage, the fixes are fairly consistent across most sites. Start with what runs unnecessarily, then reduce how hard the server has to work on each request.
- Replace heavy plugins with lighter alternatives that cover the same core function.
- Limit background tasks by replacing WP-Cron with a real server cron job and using Heartbeat Control to reduce admin polling frequency.
- Disable unused plugin modules. Security, WooCommerce, and membership plugins often run features you never enabled intentionally.
- Clean the database regularly using WP-Optimize or Advanced Database Cleaner. Limit saved post revisions in wp-config.php.
- Add caching. A caching plugin handles page-level caching. Pair it with a CDN for higher-traffic sites. Redis or Memcached with OPcache reduces repeated query and PHP compilation costs.
- Upgrade hosting if nothing else moves the needle. LiteSpeed-based hosting with NVMe storage handles concurrent requests noticeably better than Apache-based shared plans.
When It’s Not the Plugin
- Theme issues: Page builders and bloated themes generate dense HTML with excessive inline styles and large DOM structures. Even without a problematic plugin, a heavy theme can cause consistently high PHP execution times.
- Traffic spikes: A sudden influx of visitors, whether from a viral post, a press mention, or a product launch, can temporarily push CPU usage past normal limits. If spikes are short-lived and infrequent, this may not require a configuration change beyond enabling caching.
- Bot attacks: Bots crawling your site aggressively, attempting brute-force logins, or submitting spam through contact forms generate server requests that count toward CPU usage. Protecting the wp-login.php file, using a Web Application Firewall (WAF), and blocking known bad bots through your CDN or security plugin addresses this at the source.
- Poor hosting environment: If you are on a shared plan with strict CPU limits and no upgrade path, optimization can only go so far. Low-resource environments will show high relative usage even with a well-configured site.
- PHP version outdated: PHP 8.0 and above offer performance improvements over PHP 7.x, including better memory handling and faster execution. If your site is still running on an older PHP version, updating through your hosting control panel is a straightforward way to reduce processing time across the board.
Keep Your WordPress Site Efficient and Stable
High CPU usage rarely has a single cause. Most of the time, it reflects a combination of factors: a plugin with expensive background tasks, an unoptimized database, insufficient caching, and a hosting plan that leaves little room for peaks. Working through the diagnosis methodically, starting with your hosting dashboard and Query Monitor, narrows the field quickly.
Once you have identified the source, the fixes available range from free configuration changes to plugin replacements to hosting upgrades. The majority of sites can achieve meaningful reductions through caching alone and by limiting how often background tasks run. More persistent issues usually point to either a plugin that needs replacing or a hosting environment that has reached its ceiling.


Stuck Somewhere?
Connect With JustHyre
Hire WordPress Engineers for custom jobs like Website Customization, SEO Optimization, Clearing a Hacked Website, Installation & Configuration & more.
Connnect with JustHyre